If you’ve ever worked with SQL for data analysis, you know it can feel overwhelming. On paper, SQL is supposed to make data structured and clear. In truth? It typically causes data disarray.
Why SQL Data Analysis Feels Chaotic
The data you require is often scattered across various tables or systems. Slow performance caused by SQL query problems makes sophisticated queries more frustrating. Additionally, raw results and data chaos can be challenging to read without visual help. That makes SQL data analysis messy.
What do you need in this situation? Let’s opt for linking the elements in a clear, accurate, and actionable way.
What is SQL Data Analysis and Why It Matters
SQL for data analysis involves asking data questions and getting replies. This simplifies decision-making and turns data into insights.
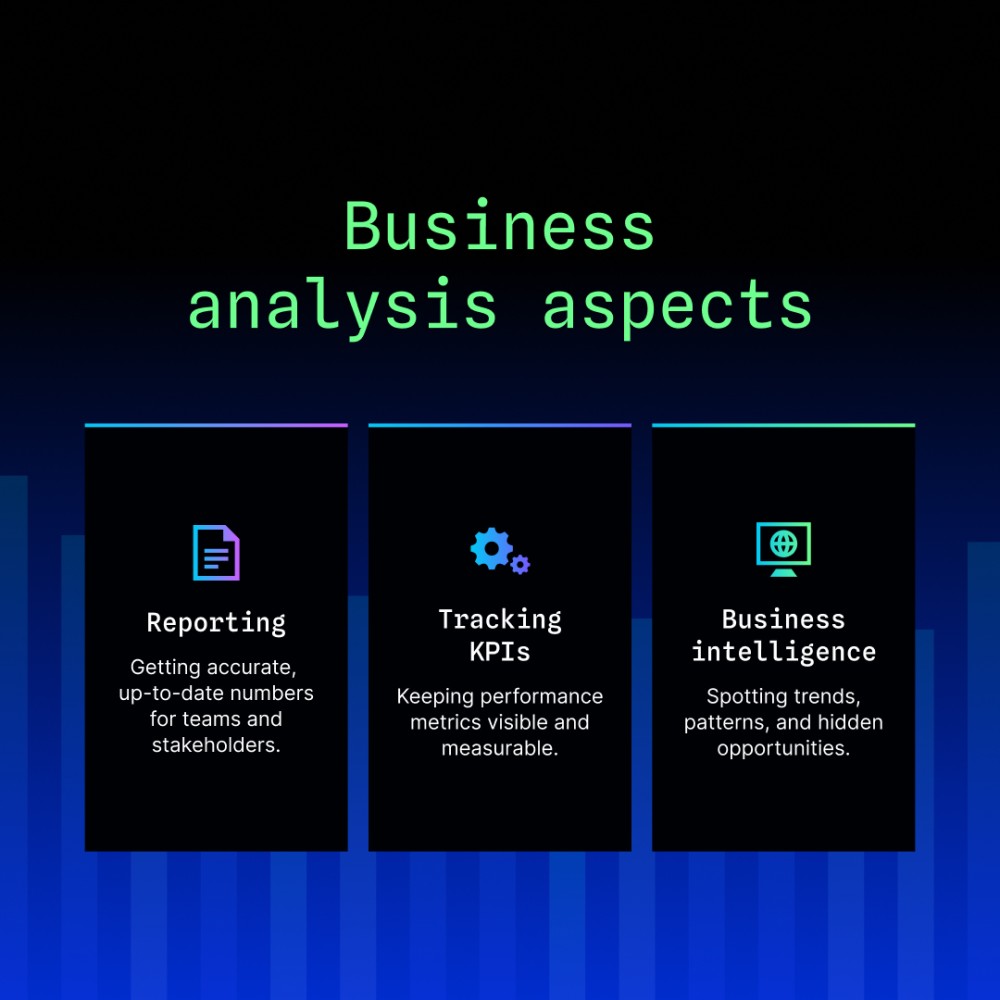
Why is SQL utilised in data analysis?
- Reporting – getting accurate, up-to-date numbers for teams and stakeholders.
- Tracking KPIs – keeping performance metrics visible and measurable.
- Business intelligence – spotting trends, patterns, and hidden opportunities.
When you put that data to use, the actual value is revealed. SQL does more than simply display events. It enables you to comprehend the reasons behind top-performing products and areas in need of improvement. The ability to extract unambiguous SQL data insights gives firms a significant advantage in a world where data is abundant.
SQL Server as the Core of Data Analysis
How to use SQL for data analysis? SQL Server has established itself as a preferred platform for working with business data. It is an SQL IDE environment that supports everything from daily reporting to extensive analytics; it is more than just a database. For this reason, many businesses choose to use SQL Server analytics tools.
You’ll see SQL Server in action across all kinds of industries. Business intelligence (BI) niche uses it to track KPIs and uncover growth opportunities. Industries with daily routines, such as finance, sales, or logistics, require it to provide accurate numbers for the managers at their fingertips to guide decisions.
The built-in toolkit is what makes SQL Server special. SQL Server Reporting Services (SSRS) can turn raw data into clear dashboards, and BI platform interfaces simplify system interaction. Teams have a single, reliable source of truth instead of scattered spreadsheets.
From basic reporting to complex SQL Server data analysis, enterprises have a stable and scalable basis.
How to Structure Your SQL Data Analysis Workflow
A good SQL data analysis workflow doesn’t run queries; it moves from raw data to clear insights in a structured way. With a well-structured workflow, you can prevent getting lost in the details and focus on what matters.
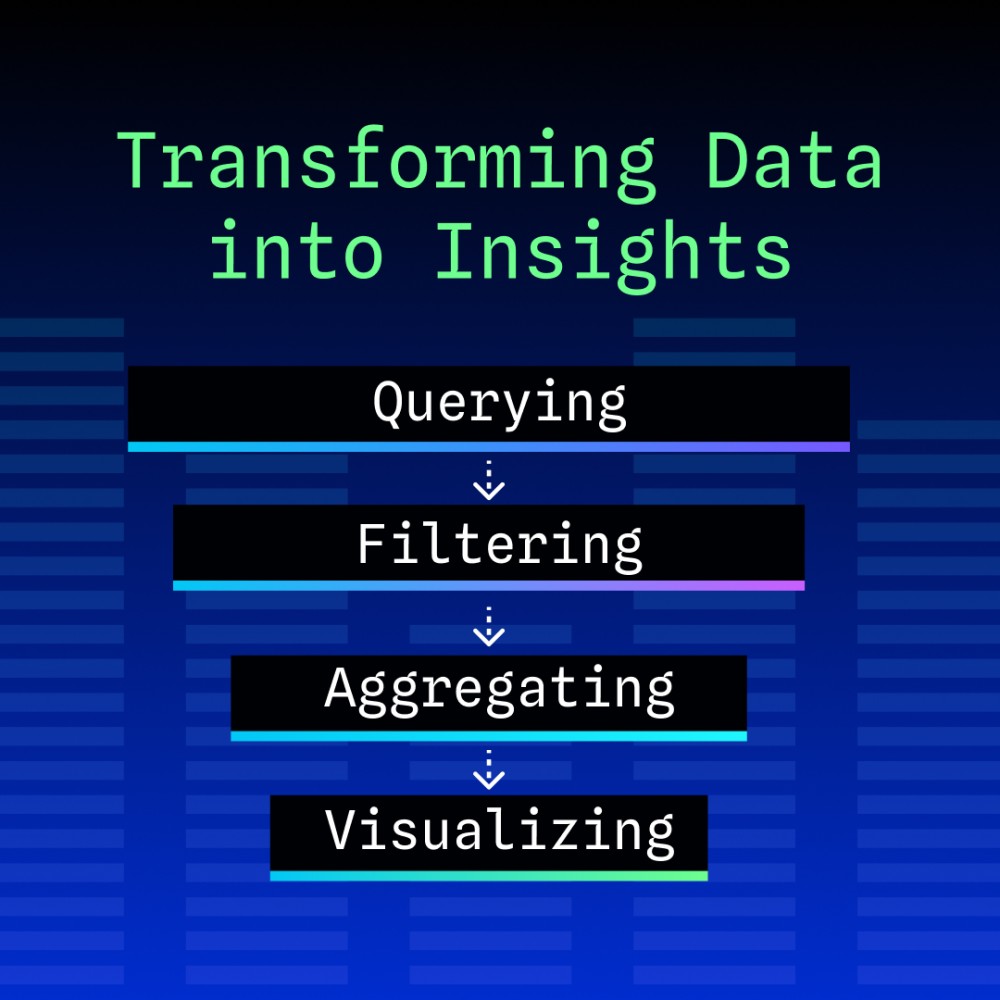
- Querying – Every query starts with an intent. You might be looking for last month’s sales data, customer activity, or performance statistics.
- Filtering – Once you’ve got your results, trim the excess. Get rid of duplicates, outdated entries, or anything that doesn’t matter to your question.
- Aggregating – Apply SQL data aggregation functionality (sums, averages, counts, etc.) to turn raw entries into summaries. This way, you aren’t drowned in rows and you get a big-picture view.
- Visualizing – Numbers become insights. You can connect your queries to charts, dashboards, or reporting tools. The SQL data workflow will transform scaring tables into simple insights.
Visualizing SQL Data for Better Insights
Rows and rows of query results might be accurate, but they’re not always useful. The real magic happens when you visualize SQL data. Suddenly, shifts in performance, changes in customer behavior, or unusual outliers become obvious.
SQL data retrieval is only half the job. Real value comes from seeing the numbers. Endless tables full of rows don’t make it easy to spot trends, but when you visualize SQL data, everything becomes evident.
That’s why SQL data visualization makes all the difference. Transforming raw data into charts, dashboards, or reports allows teams to navigate data and gain greater visibility. Instead of digging through spreadsheets, they can visualize changes in performance, customer behavior, or market trends.
What is SQL used for in data analysis? The options are flexible:
- Charts – bar, line, or pie charts to highlight comparisons and changes over time.
- Dashboards – interactive SQL data dashboards that keep all your KPIs in one place.
- Export options – sending results to Excel, BI tools, or reports so insights are easy to share.
Analyzing SQL Data with dbForge Studio for SQL Server and AI Assistant
Working with SQL data analysis tools doesn’t have to be complicated. dbForge Studio for SQL Server takes the usual grind of querying, cleaning, and presenting data and makes it straightforward.
You can develop queries step-by-step using the visual query builder, eliminating the need to fumble with code. The results are presented in a clean grid view that allows for real-time editing and filtering. Need to transform flat data into an aggregated format? It’s simple thanks to the pivot table. Additionally, the chart view transforms rows and data into readable graphics for quick pattern recognition.
However, the integrated AI Assistant is the true game-changer. You don’t need to be an expert to produce effective queries with AI tools for SQL Server. AI for SQL data analysis works this way: simply submit your query in plain English, and the SQL AI assistant will generate the code. It will also help you debug your code faster, explain complex logic, and recommend optimization options.
There are numerous real-world applications:
- Trend analysis – spotting shifts in customer behavior or sales performance.
- KPI reports – converting raw data into dashboards for stakeholders.
- Extensive dataset summaries – condensing millions of rows into clear, digestible insights.
To put it briefly, dbForge Studio for SQL Server with its AI support helps close the gap between the analysis of raw SQL Server data and insights that are ready for business.
Making Better Decisions with SQL
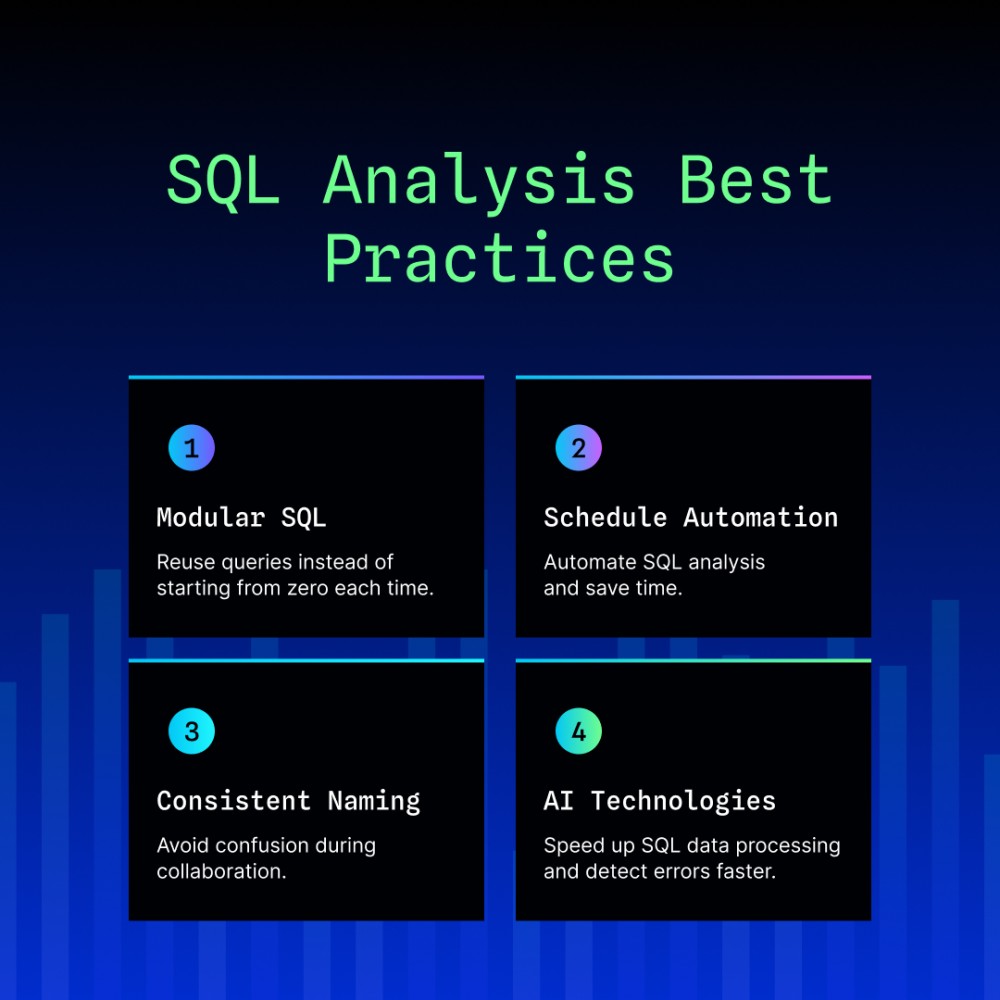
The real value of SQL shows up in the choices it helps you make. To get there consistently, it’s worth following a few simple SQL analysis best practices:
- Use clean, modular SQL to reuse queries instead of starting from zero each time.
- Schedule queries, reports, or exports to automate SQL analysis and save time.
- Consistent naming of tables, columns, and queries helps avoid confusion during collaboration.
- AI-based technologies speed up SQL data processing, detect errors faster, and focus on analysis rather than syntax.
Structure, automation, and the correct tools make data analysis using SQL a solid system for making smarter, faster, and data-driven decisions.
With the proper structure, automation, and tools, you can build a fast, data-driven system from a data analysis using SQL.
Originally published on LinkedIn